Tracked gages
Tracking a gage adds it to your personal set. Tracked gages share a dashboard, can be compared on one chart, feed the reporting workbooks, and are where monitors and archive restores attach. Every plan includes tracking; the cap rises with tier.
Overview
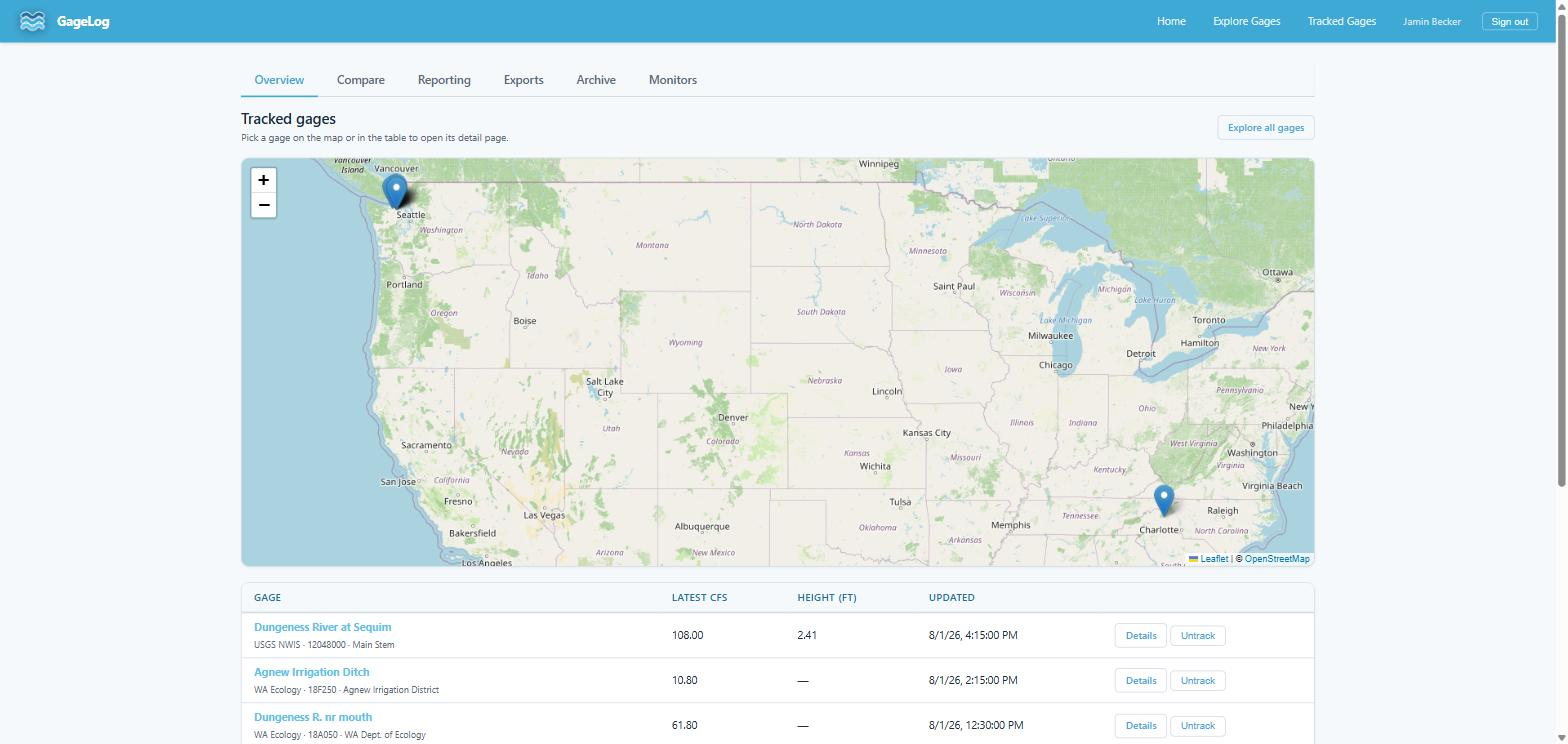
One card per tracked gage — latest reading, condition dot, and a sparkline — with the same tab strip across all Tracked Gages pages. Track and untrack from any gage's detail page; untracking never deletes data.
Compare
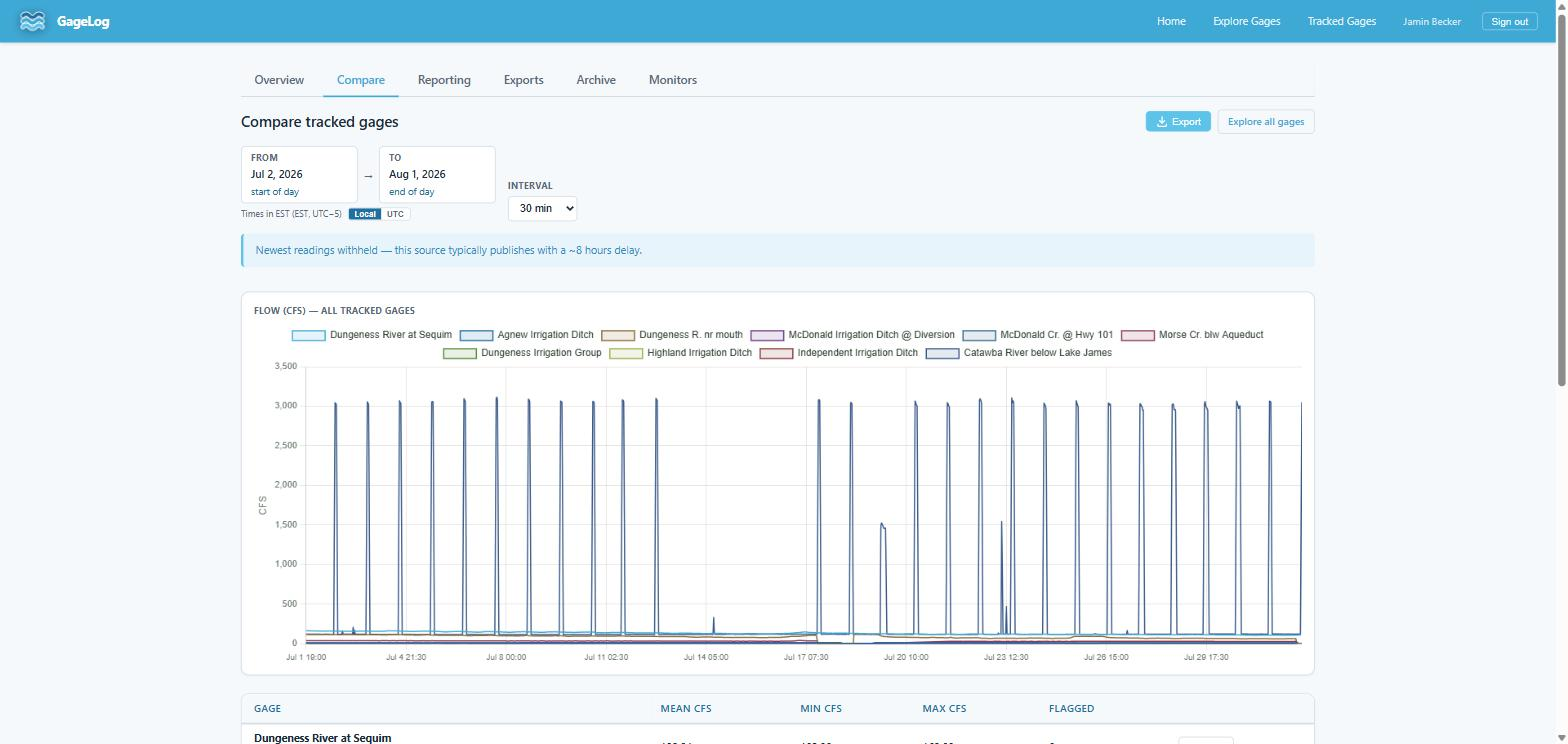
Every tracked gage on one chart over a common date range, for flow and (where reported) stage. Useful for watching a storm move through a basin or checking relative response between a mainstem and its tributaries. The comparison exports as one spreadsheet: a CFS sheet and a Height sheet, a column per gage, a row per time bucket.
Reporting
Four configurable exports over any subset of your tracked gages — data, visualization, and statistics workbooks, plus the flow-conditions PDF. Details on the Exports page.
Exports
Report builds run in the background; this tab lists finished files, ready to download. Builds typically take seconds to a couple of minutes depending on gage count and date span.
Archive
Shows, per tracked gage, how much history sits in long-term storage and which spans are currently restored. The newest water years stay instantly queryable; older readings are restored on demand. Newly tracked gages automatically restore their last decade. Restores are per-gage, per-water-year spans and are available on plans with archive access — the full mechanics live on the Archive & restore page.