Charts & statistics
Every chart on a gage page carries a "What is this?" panel with its exact formula. This page collects the conventions those formulas share, so you can judge whether a number is fit for your purpose.
Conventions that apply everywhere
- Water year. October 1 – September 30, labeled by the calendar year it ends in: October 2024 falls in water year 2025. All annual statistics and year-over-year comparisons use water years.
- Flagged readings. Readings that fail basic quality checks (for example, negative discharge) are stored but flagged, plotted in red, and excluded from every average, percentile, and daily summary. A reading being unflagged does not make it final — see provisional data.
- Day boundaries. Stored daily summaries (used by the year-over-year, water-year, and annual charts) aggregate on UTC calendar days. The Daily Flow Range chart buckets in your display timezone instead, so the two can differ slightly for the same nominal day. Each chart's formula panel states which basis it uses.
- Units. Discharge is measured in cubic feet per second (1 CFS = 448.831 gal/min); stage in feet. You can switch display units in Settings — conversions happen at display time and never alter stored data.
Daily and annual statistics
A day's mean, minimum, and maximum are computed over its unflagged readings. Annual (water-year) statistics are built from these daily values: the annual mean is the unweighted mean of daily means, so each day counts equally regardless of how many readings it contains, and days with no valid readings are excluded. This is the standard construction for records with uneven reading counts; be aware it is not the same number as a mean over all raw readings.
The percentile envelope
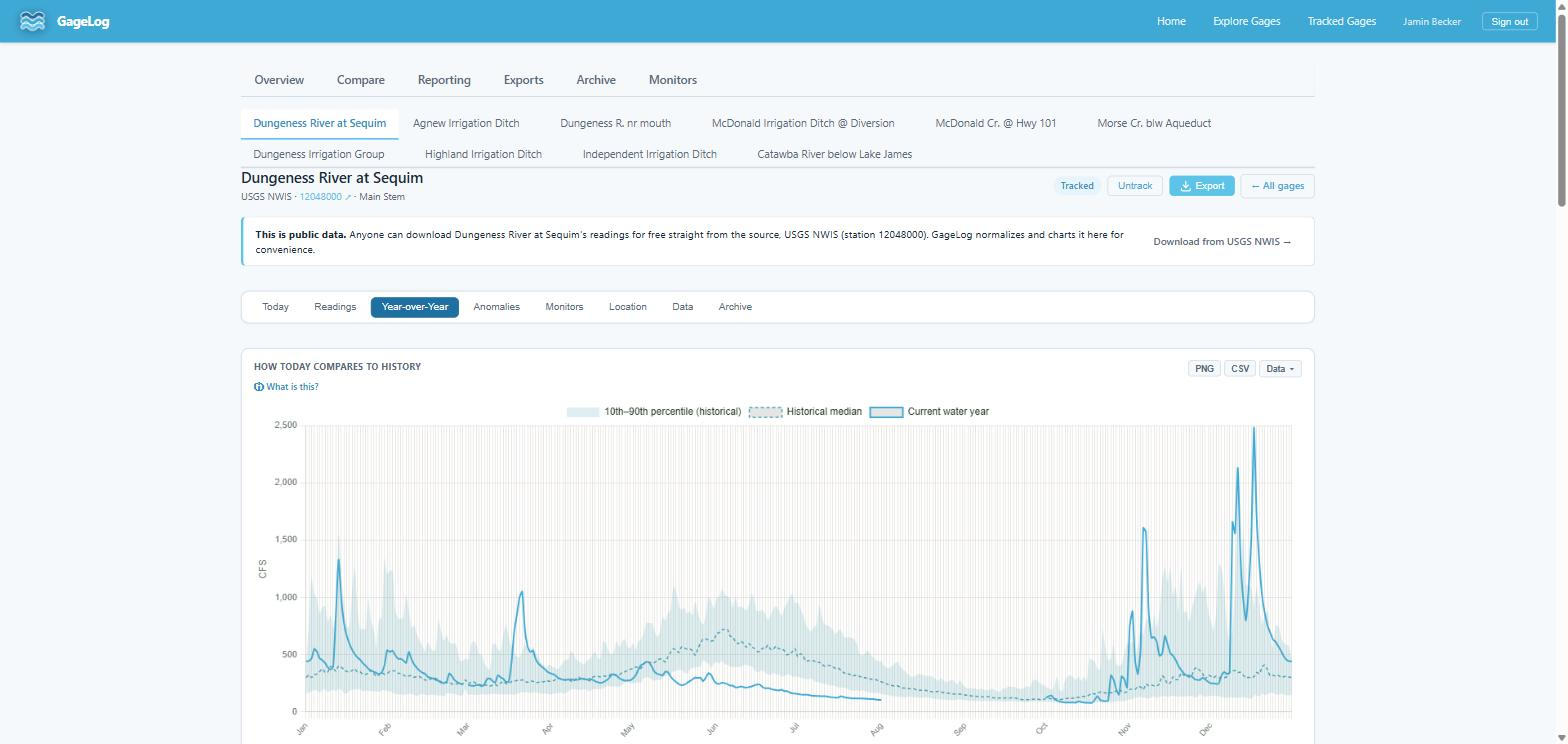
"How Today Compares to History" bands the 10th–90th percentile of daily mean flow for each day of the year, computed from all prior water years with linear interpolation between order statistics, with the median dashed. The current water year plots on top. An excursion outside the band puts the season in the top or bottom decile of record for that date. At least three prior water years are required before the chart renders.
Flow-duration curves
Readings in the window are ranked and plotted against the percentage of time each value was equaled or exceeded, on a log flow axis. Zero and negative values are excluded, and at least five qualifying readings are required. Curve shape is diagnostic: steep indicates flashy, runoff-driven response; flat indicates baseflow dominance or regulation.
Anomaly detection
Two independent detectors, both tunable per-request and in account defaults:
- Z-score: each reading is tested against the mean and sample standard deviation of the trailing 30 days of unflagged readings (the reading itself excluded). Default threshold |z| ≥ 3.
- Step change: consecutive readings are compared as a relative change, with the denominator floored at 1 CFS so near-zero baseflow doesn't produce meaningless ratios. Default threshold 50%.
The detectors flag statistical departures, not causes. A legitimate dam release and a sensor fault can look identical to them; the value is being told promptly that something departed from pattern.
Insight cards and condition dots
The computed statements on the Today tab (current flow vs. period median, trend direction over recent days, the day's maximum, flagged-data share) are restatements of the chart data, not forecasts. Condition dots (high/normal/low) compare against the gage's own 25th and 75th percentile daily means over its whole record — "high" is high for that river, and at least 30 days of history are required before a dot is shown.