The gage detail page
Every gage has one page, organized into tabs. All tabs are visible to everyone; without an account the data window is capped at the last 7 days, and some tabs (Year-over-Year, Monitors, Archive) explain what they'd show and how to unlock it.
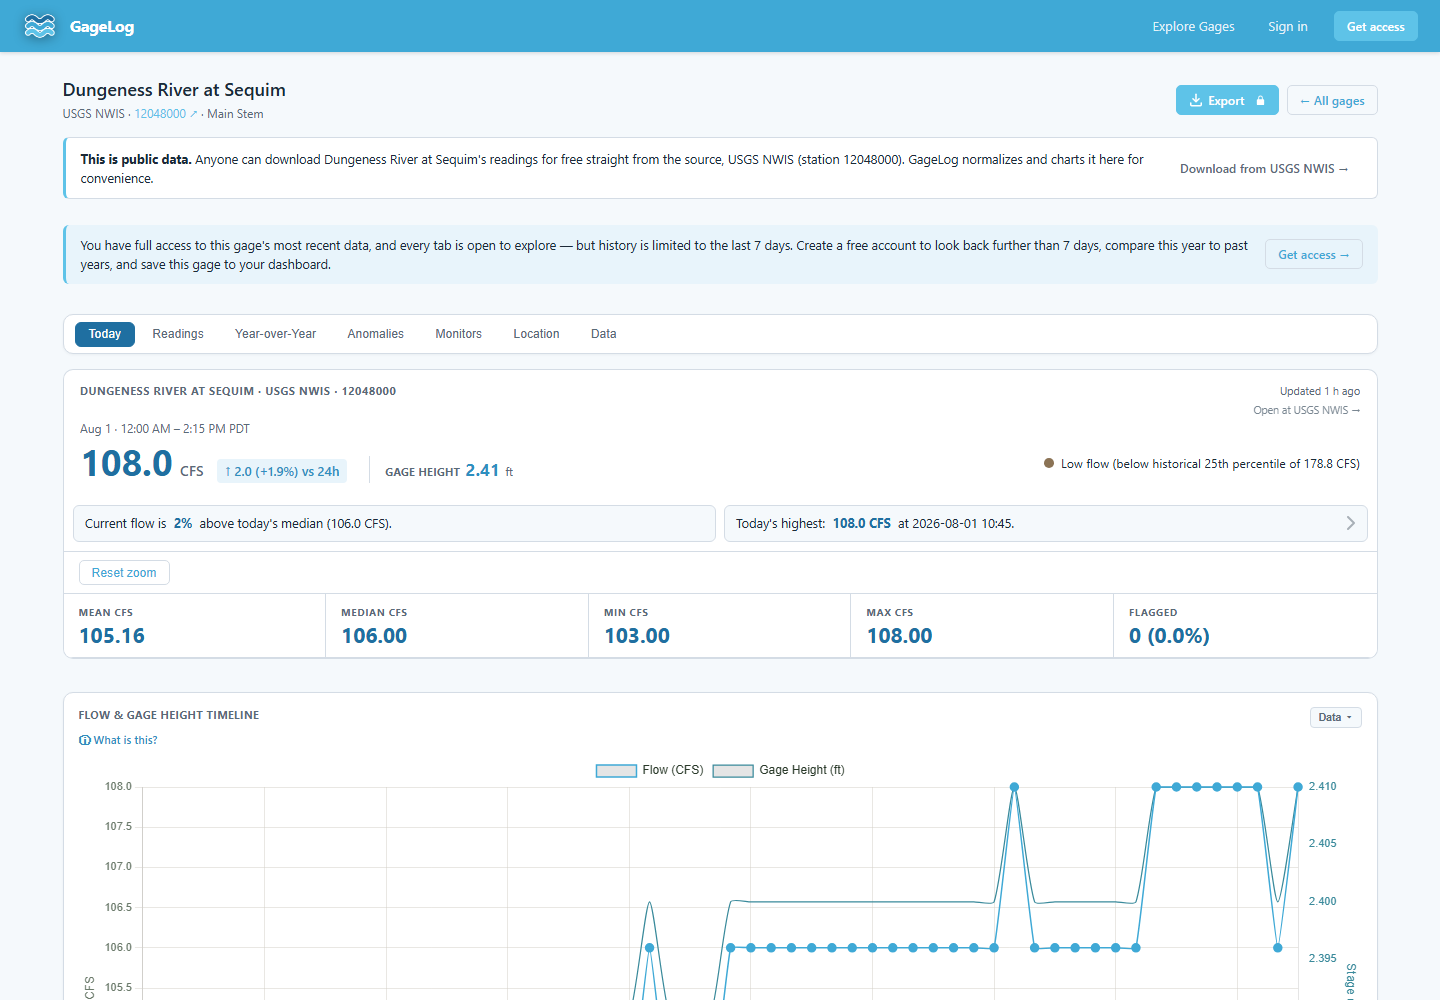
Today
Current conditions: the latest reading with a high/normal/low status dot (relative to the gage's own 25th–75th percentile record), insight cards with computed statements about the day — current flow vs. period median, trend over recent days, the day's peak — and three charts: the flow and stage timeline, a 24-hour flow-duration curve, and a distribution histogram. Click an insight card to jump to the reading behind it.
Readings
The same charts over any date range you pick, at the interval you pick, plus a daily min–mean–max range chart. The timeline adds a configurable trailing moving average. Zoom with scroll or pinch; drag to pan; click any point for the full reading and its metadata.
Year-over-Year
Long-horizon context: today's flow against the historical percentile envelope for the date, every water year overlaid on one seasonal axis, and annual statistics per water year. Needs multiple years of record — the page states the minimum where it applies. See Charts & statistics for the exact definitions.
Anomalies
Two detectors run over your selected range: a z-score test against the trailing 30 days, and a step-change test against the prior reading. Both thresholds are adjustable on the tab, and flagged readings are listed in a table under the chart. Detector math is on the Charts & statistics page.
Monitors
Monitors attached to this gage, if your plan includes them — see Monitors & alerts.
Location
The station on a map, along with its metadata: operating agency, station ID, and a link to the source record.
Live
A live camera view, for the minority of stations that have one.
Data
The raw readings as a table, with export to spreadsheet. Flagged readings are marked. Paid plans add derived columns and workbook exports — see Exports & the API.
Archive
Readings older than the hot-storage window live in long-term storage. This tab shows how much archived history the gage has and, on plans with archive access, lets you restore a span for analysis and reporting. Newly tracked gages restore their last decade automatically.