Exports & the API
Four report types cover most deliverable needs; the REST API covers the rest. Reports build in the background and appear on the Exports tab when ready.
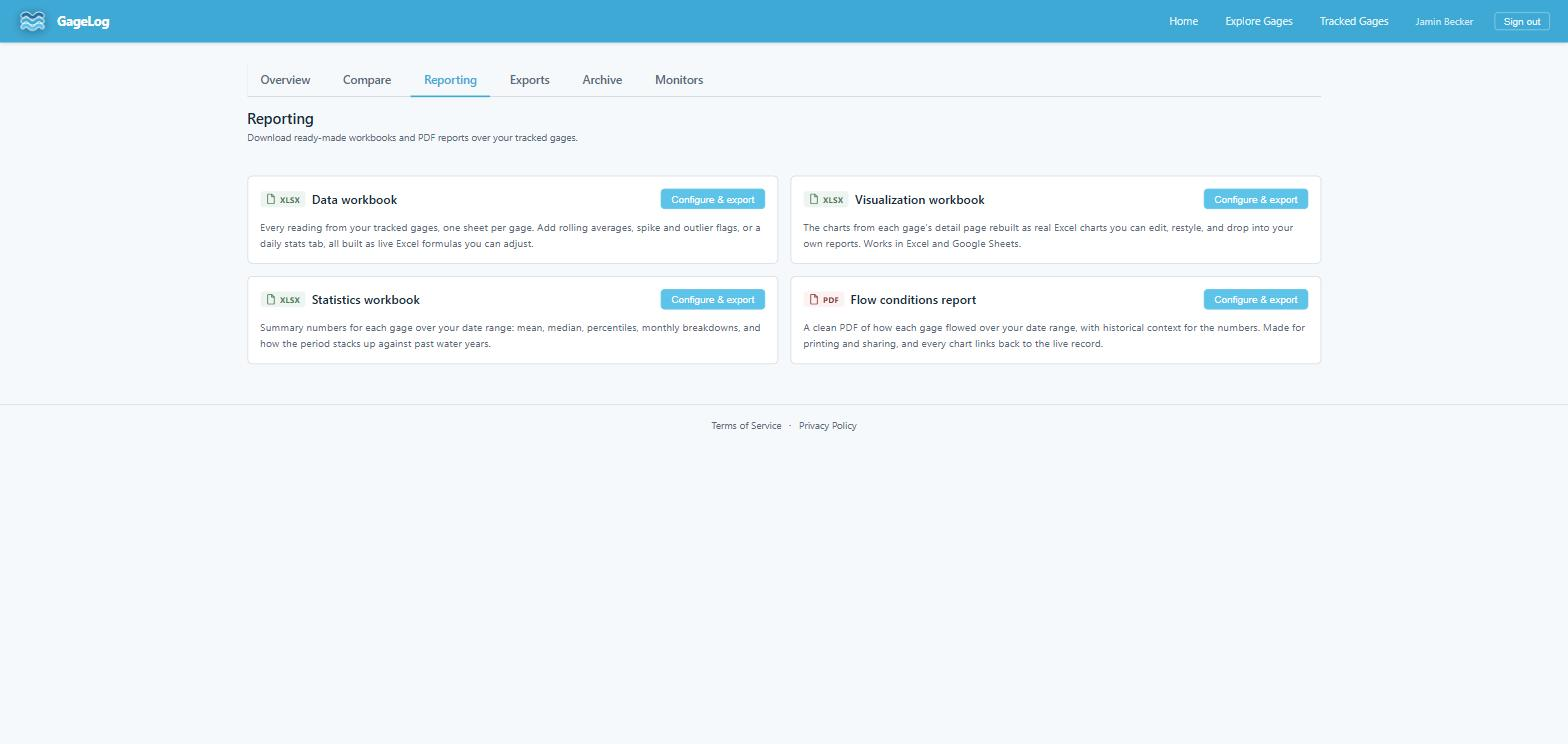
Data workbook (Excel)
Every reading from your selected gages, one sheet per gage, with optional derived columns — rolling averages at several windows, percent-change and spike flags, z-score and outlier flags, and a per-gage daily statistics sheet. Derived columns are built as live Excel formulas with their thresholds on a Params sheet, so you can adjust them in the workbook without rebuilding the export.
Visualization workbook (Excel)
The charts from the gage detail page rebuilt as native Excel charts — hydrograph, percentile envelope, flow-duration, distribution, daily range, water-year comparison, annual statistics, and several deep-dive panels (cumulative volume, flow-condition classes, monthly distribution). Native charts mean you can restyle them and paste them into your own documents. Works in Excel and Google Sheets.
Statistics workbook (Excel)
Summary statistics per gage over your date range: mean, median, percentiles, monthly breakdowns, and the period set against prior water years.
Flow conditions report (PDF)
A print-ready PDF of daily flow per gage with percentile context and flow-condition classes (the standard USGS WaterWatch classes, from "Much below normal" to "Much above normal", based on period-of-record percentiles for the day of year). Every chart links back to the live record.
Single-gage exports & plan rules
Any gage detail page's Export button downloads that gage's readings as CSV or an Excel workbook with the derived columns above. What you can export depends on your plan:
- Free: CSV only, up to 7 days of data per export (start and end dates required).
- All paid plans: Excel (.xlsx) exports of any individual gage plus the multi-gage comparison spreadsheet, with unlimited date ranges (Excel workbooks cap at 366 days per file).
- Middle tier and up: the multi-gage reporting workbooks and PDF above.
403; a CSV export over your plan's day cap (or without
start/end on a capped plan) returns
400 with the limit in the error detail.
The REST API
Everything the site displays is available under /api/v1/.
Authentication is by session, JWT, or — on the Research plan —
long-lived API keys managed from the
API console.
The REST API guide covers
access, authentication, and rate limits; the interactive reference lives
at /api/docs/
(OpenAPI JSON: /api/schema/).
| Endpoint | Returns |
|---|---|
GET /api/v1/gages/?gage_key=…&start=…&end=… |
Readings for a gage over a date range |
GET /api/v1/sources/available/ |
Gages available to your account |
GET /api/v1/subscriptions/me/ |
Your plan and limits |
Source access through the API follows your plan's source cap, the same as the site.